Citronellal
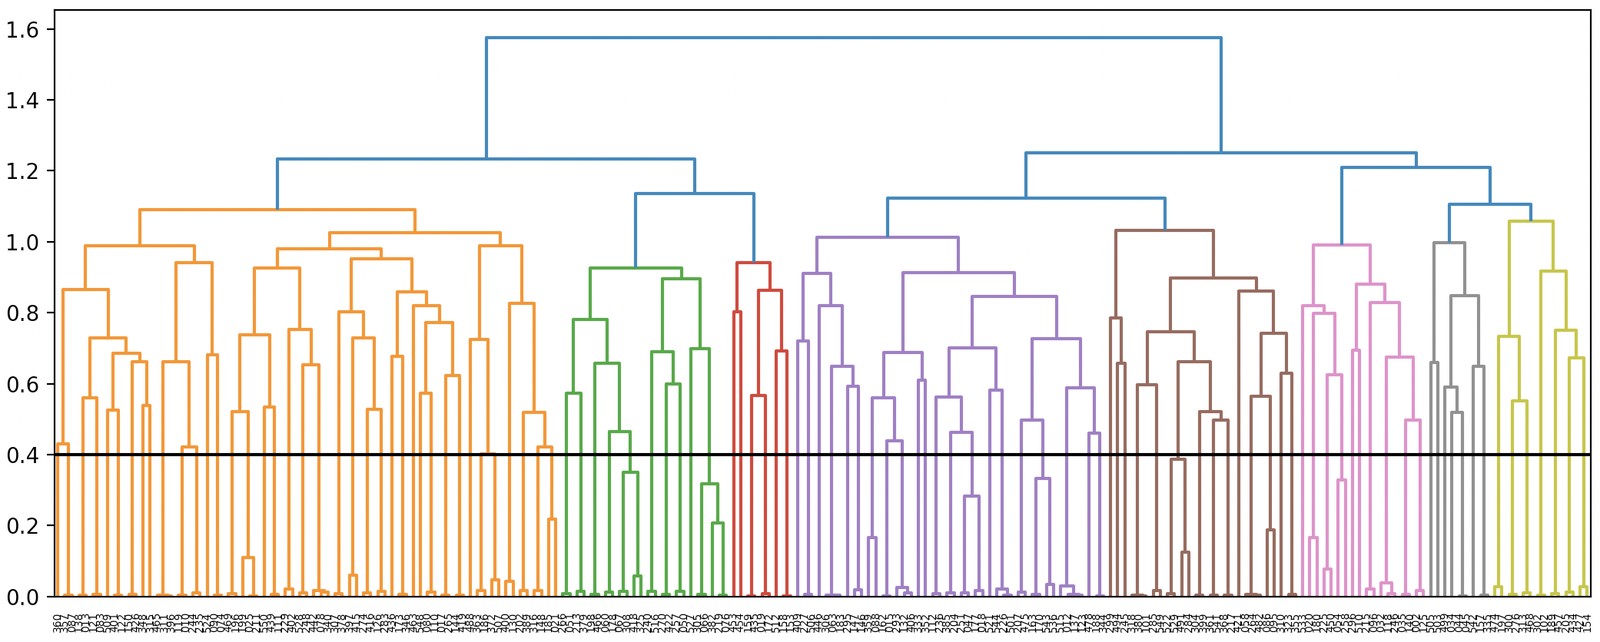
Clusterization of the VCD spectra computed for 256 low-energy conformers of Citronellol. The correlation index, given on the Y-axis of the dendrogram, indicates how similar/different are the spectra of the conformers/families connected via an horizontal segment. Identical spectra have a correlation index of 0, while mirror image spectra have a correlation index of 2. Correlation values of 0.4 and 0.2 are associated with spectra that are 60% and 80% similar, respectively (according to Tanimoto metric).